


The iconic cover of Joy Division’s legendary debut album “Unknown Pleasures” (1979) features a striking image of a pulsar’s radio waves. It is a graphic visualization of abstract data representing radio frequency periods from the first pulsar discovered a.k.a. CP1919.
More about pulsars and how the data was collected is finely explained in the Scientific American article.
How this ended up on the album cover has been told over and over. Here is a pretty nice summary.
I always liked Joy Division (and New Order) and thought it would be a fun project to recreate the Ridgeline plot on a period(-ish) correct pen plotter. Here we go…
What we are after is the raw data and finding out ways to plot this image again, on period correct(-ish) plotters. That will be a fun project.
Luckily most of the hard work has been done. No surprises here, since the plot appeared on many posters, T-shirts, Mosaics and even body parts. The RAW data is found here in a convenient CSV file. Every Tattoo artist uses Excel right?

I used the programming environment R to work through the data and generate the lines one by one.
In short: Read in the CSV file, then plot the image and save the result in a SVG file.
> pulsar <- readr::read_csv("cp1919.csv")

> library(ggplot2)
library(ggridges)

col1 <- "white"
col2 <- "black"

image=ggplot(pulsar, aes(x = x, y = y, height = z, group = y)) +
  geom_ridgeline(
    min_height = min(pulsar$z),
    scale = 0.2,
    linewidth = 0.5,
    fill = col1,
    colour = col2
  ) +
  scale_y_reverse() +
  theme_void() +
  theme(
    panel.background = element_rect(fill = col1),
    plot.background = element_rect(fill = col1, color = col1),
  )

 > ggsave(file="joyplot.svg", plot=pulsar, width=10, height=8)
This R code reads a CSV file containing pulsar data, creates a ridgeline plot using the ggplot2 and ggridges libraries, and saves the plot as an SVG file. The plot visualizes the pulsar data with the x and y axes representing different variables and the height of the ridgelines z. The plot has a white background and the ridgelines are colored black.
When we open this SVG file in Inkscape, we notice that there are filled polygons obscuring the underlying lines. This is a nice visual effect, but not wanted in our plot data.

Pen plotters draw lines and are not able to draw ‘between the lines’ so to speak. The result would be this plot (the same plot, with disabled fills):

How do we tackle this? We need underlying lines to appear hidden. Inkscape has no built-in function for this. Combining paths and flattening is not easily done with this many objects.
There are some ways that work somehow, but result in artefact or low resolution images. We like to work with the productive command-line tool vpype. The vpype occult function allows you to control the visibility of underlying lines in your plot. When you use this function, it effectively “hides” the specified lines, ensuring that only the desired elements are visible in the final output.
Sounds promising, but the result was pretty horrible. The fills are gone allright, but vpype doesn’t handle the filled polygons well and leaves unwanted strokes, the outlines of these polygons (marked red in image below).

Unfortunately there was no easy way to remove all unwanted red paths with Inkscape selection tool or in the SVG file and I had to do it by hand.
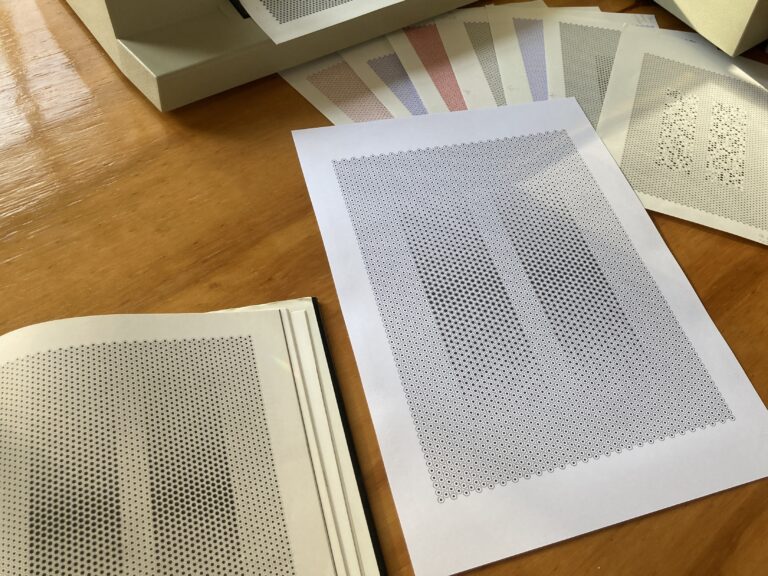
This took some time and elbow grease, but the final result was piped through vpype into a plottable file and it looked outstanding once plotted. Check out the endresult in our shop.
Do you like this slightly technical articles about our work? Please let us know in the comments.
While browsing through the book ‘Colour’ I noticed a fascinating drawing in black ink on white paper that changes colour right before your eyes.
This and more about recreating this artwork from the artist and teacher Arthur Hoener (1933-1987) after the jump.

We got some new gear. Really nice old sturdy gear from 1988. We were having a blast with it while testing and fixing problems.
We have welcomed another big pen plotter to the fleet. The notorious HP 7596A DraftMaster II. In this post I’ll cover the whole process from buying an in unknown working state vintage plotter, hauling it back home, to getting it ready for some serious production work.
Note: We’re not interested in ads, spam and other productivity undermining emails.